Case Study · Internship
DQA
Redesign.
Redesigning enterprise SaaS workflows to improve efficiency, clarity, and usability for the life science industry.
Case Study · Internship
Redesigning enterprise SaaS workflows to improve efficiency, clarity, and usability for the life science industry.
01 · Overview
Data Quality Analyst (DQA) is an AI-powered SaaS platform that automates document review for the life science industry, assisting teams in managing and validating large volumes of regulatory documentation.
Osprey Software requested a redesign of key DQA workflows to improve efficiency, clarity, and usability across both customer-facing and employee-facing interfaces.
02 · The Challenge
This project gave me hands-on experience working directly with developers in a real product environment. I learned a significant amount about preparing clean design documentation for developer handoff and designer-developer collaboration. Designing for a data-heavy environment meant balancing the need to include extensive information while maintaining clarity and cognitive load.
03 · Design Process
I was tasked with redesigning two core sections of the DQA platform, each presenting unique structural challenges.
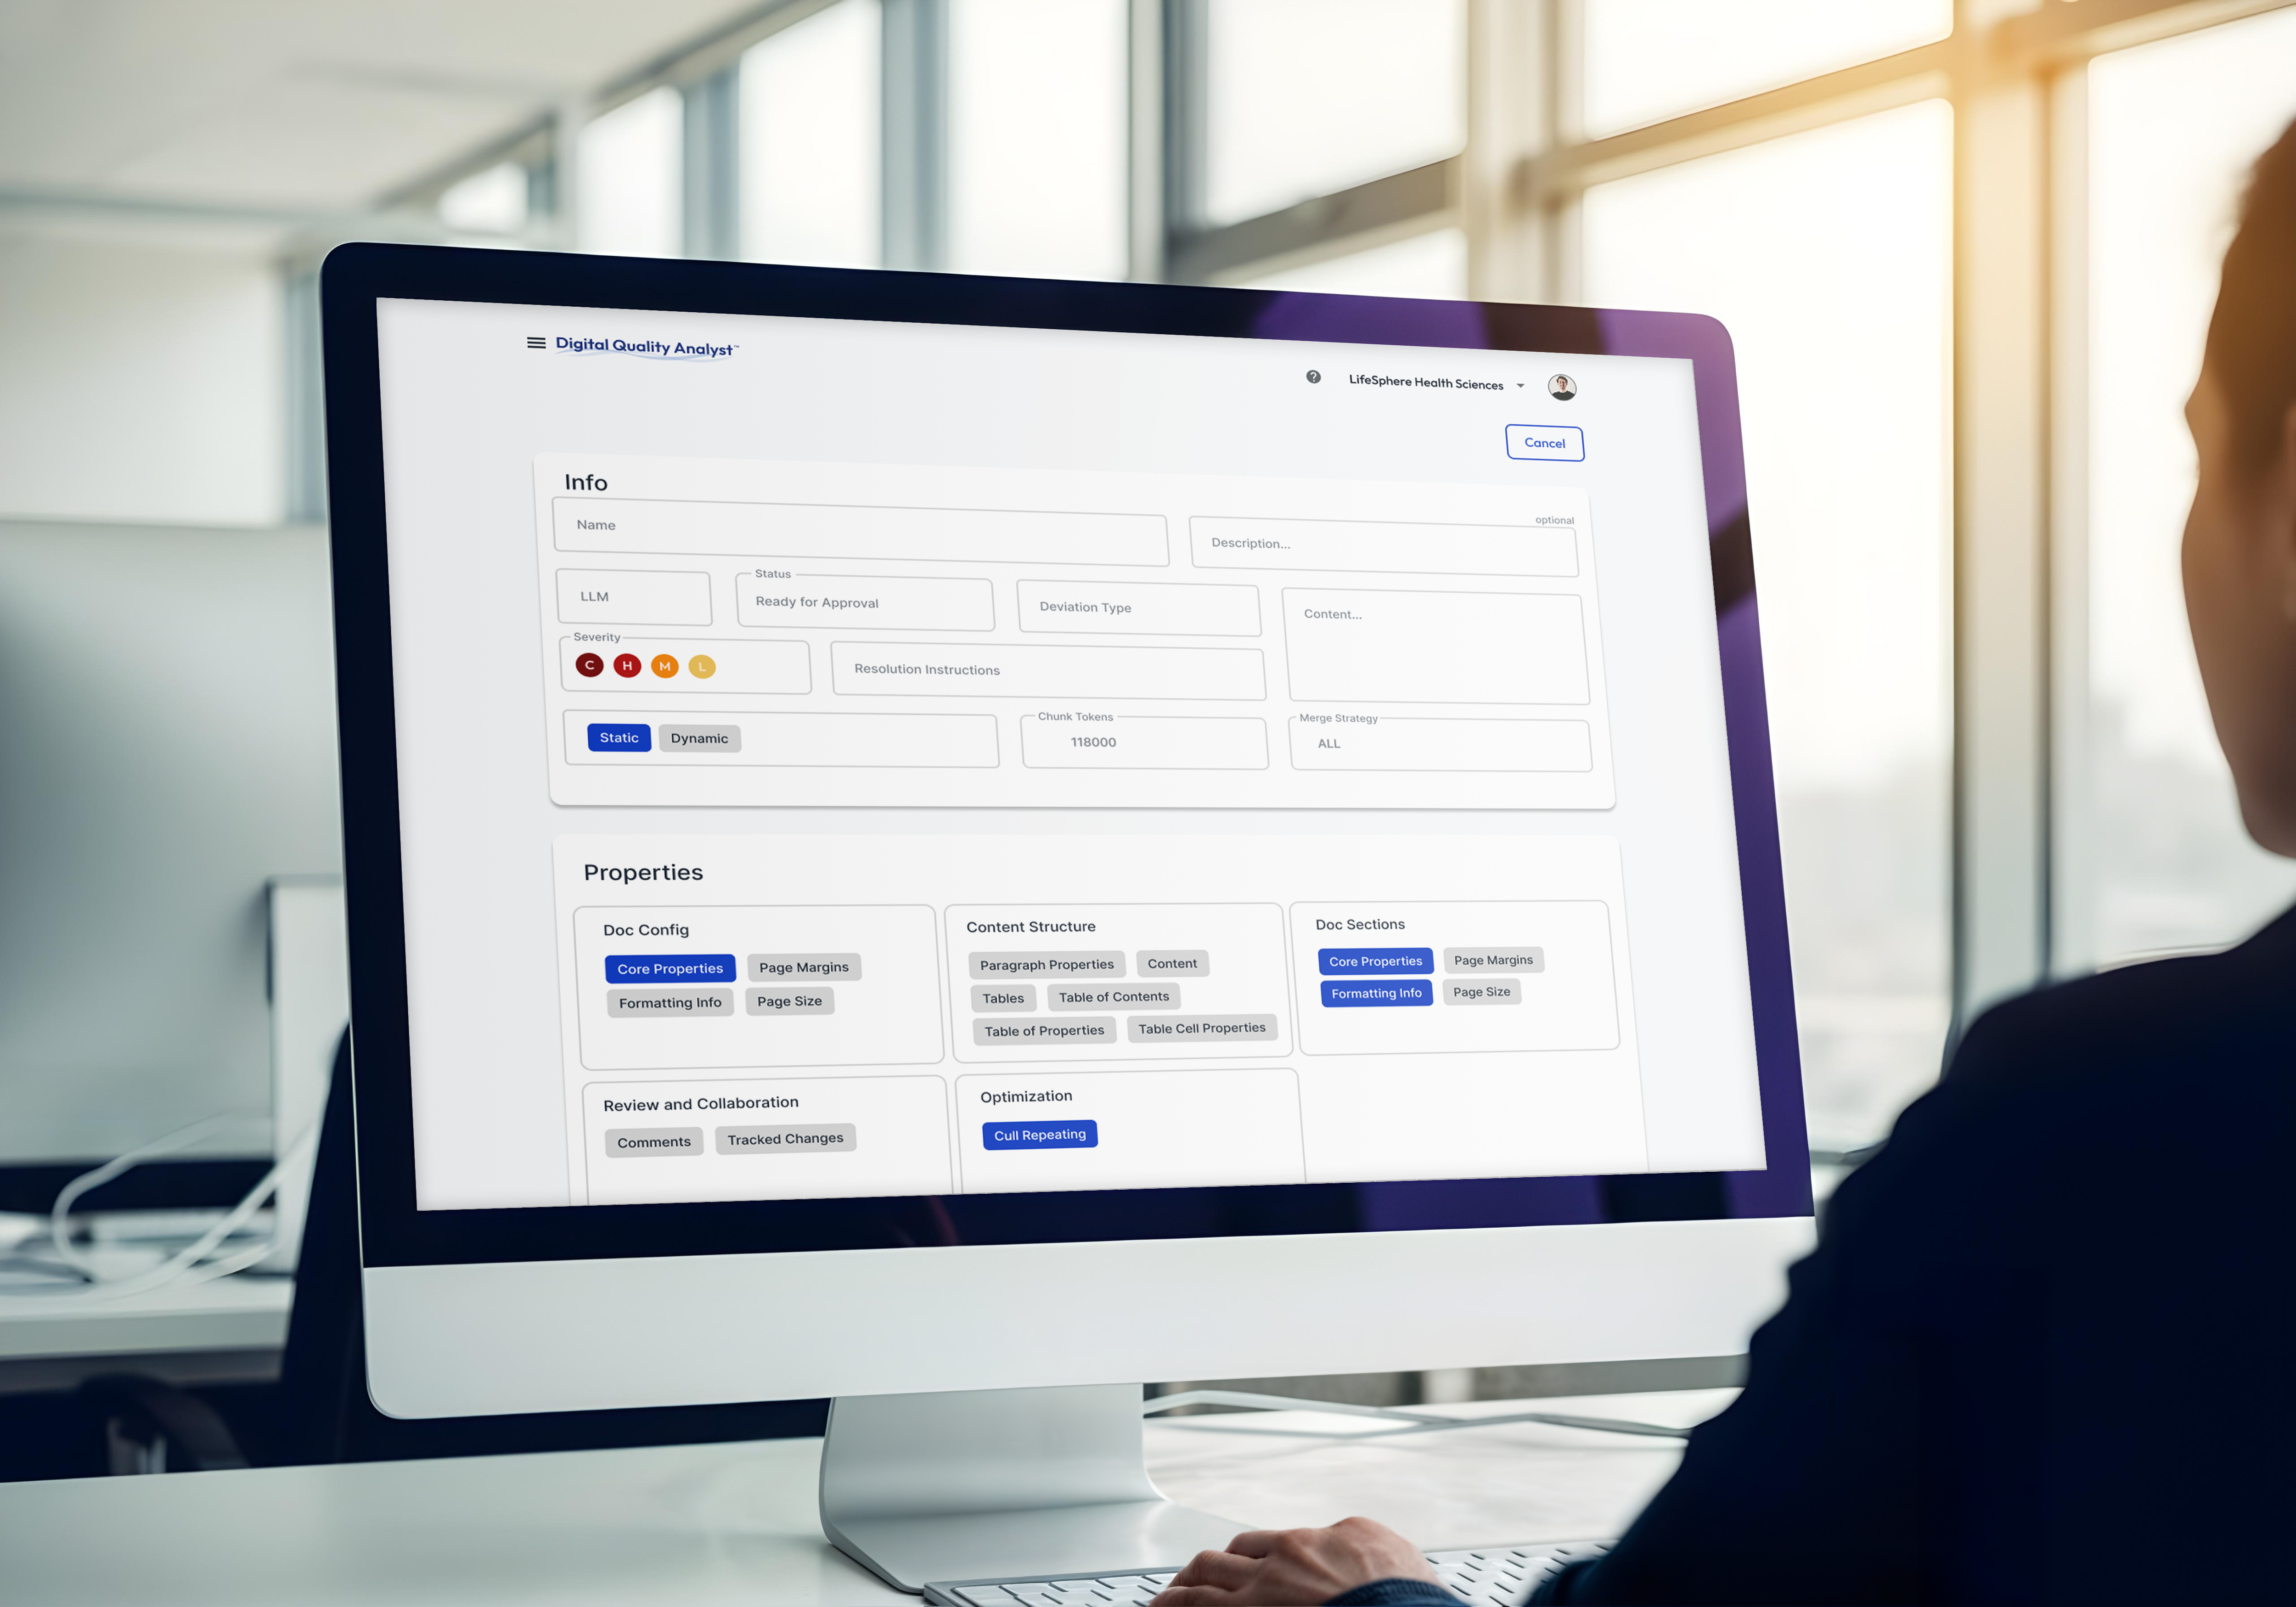
The Rule Creation page is an internal DQA tool used by Osprey employees to build AI rules and bundle them into rulesets for customer projects. The original layout lacked structure and scalability, making rule creation and expansion inefficient.
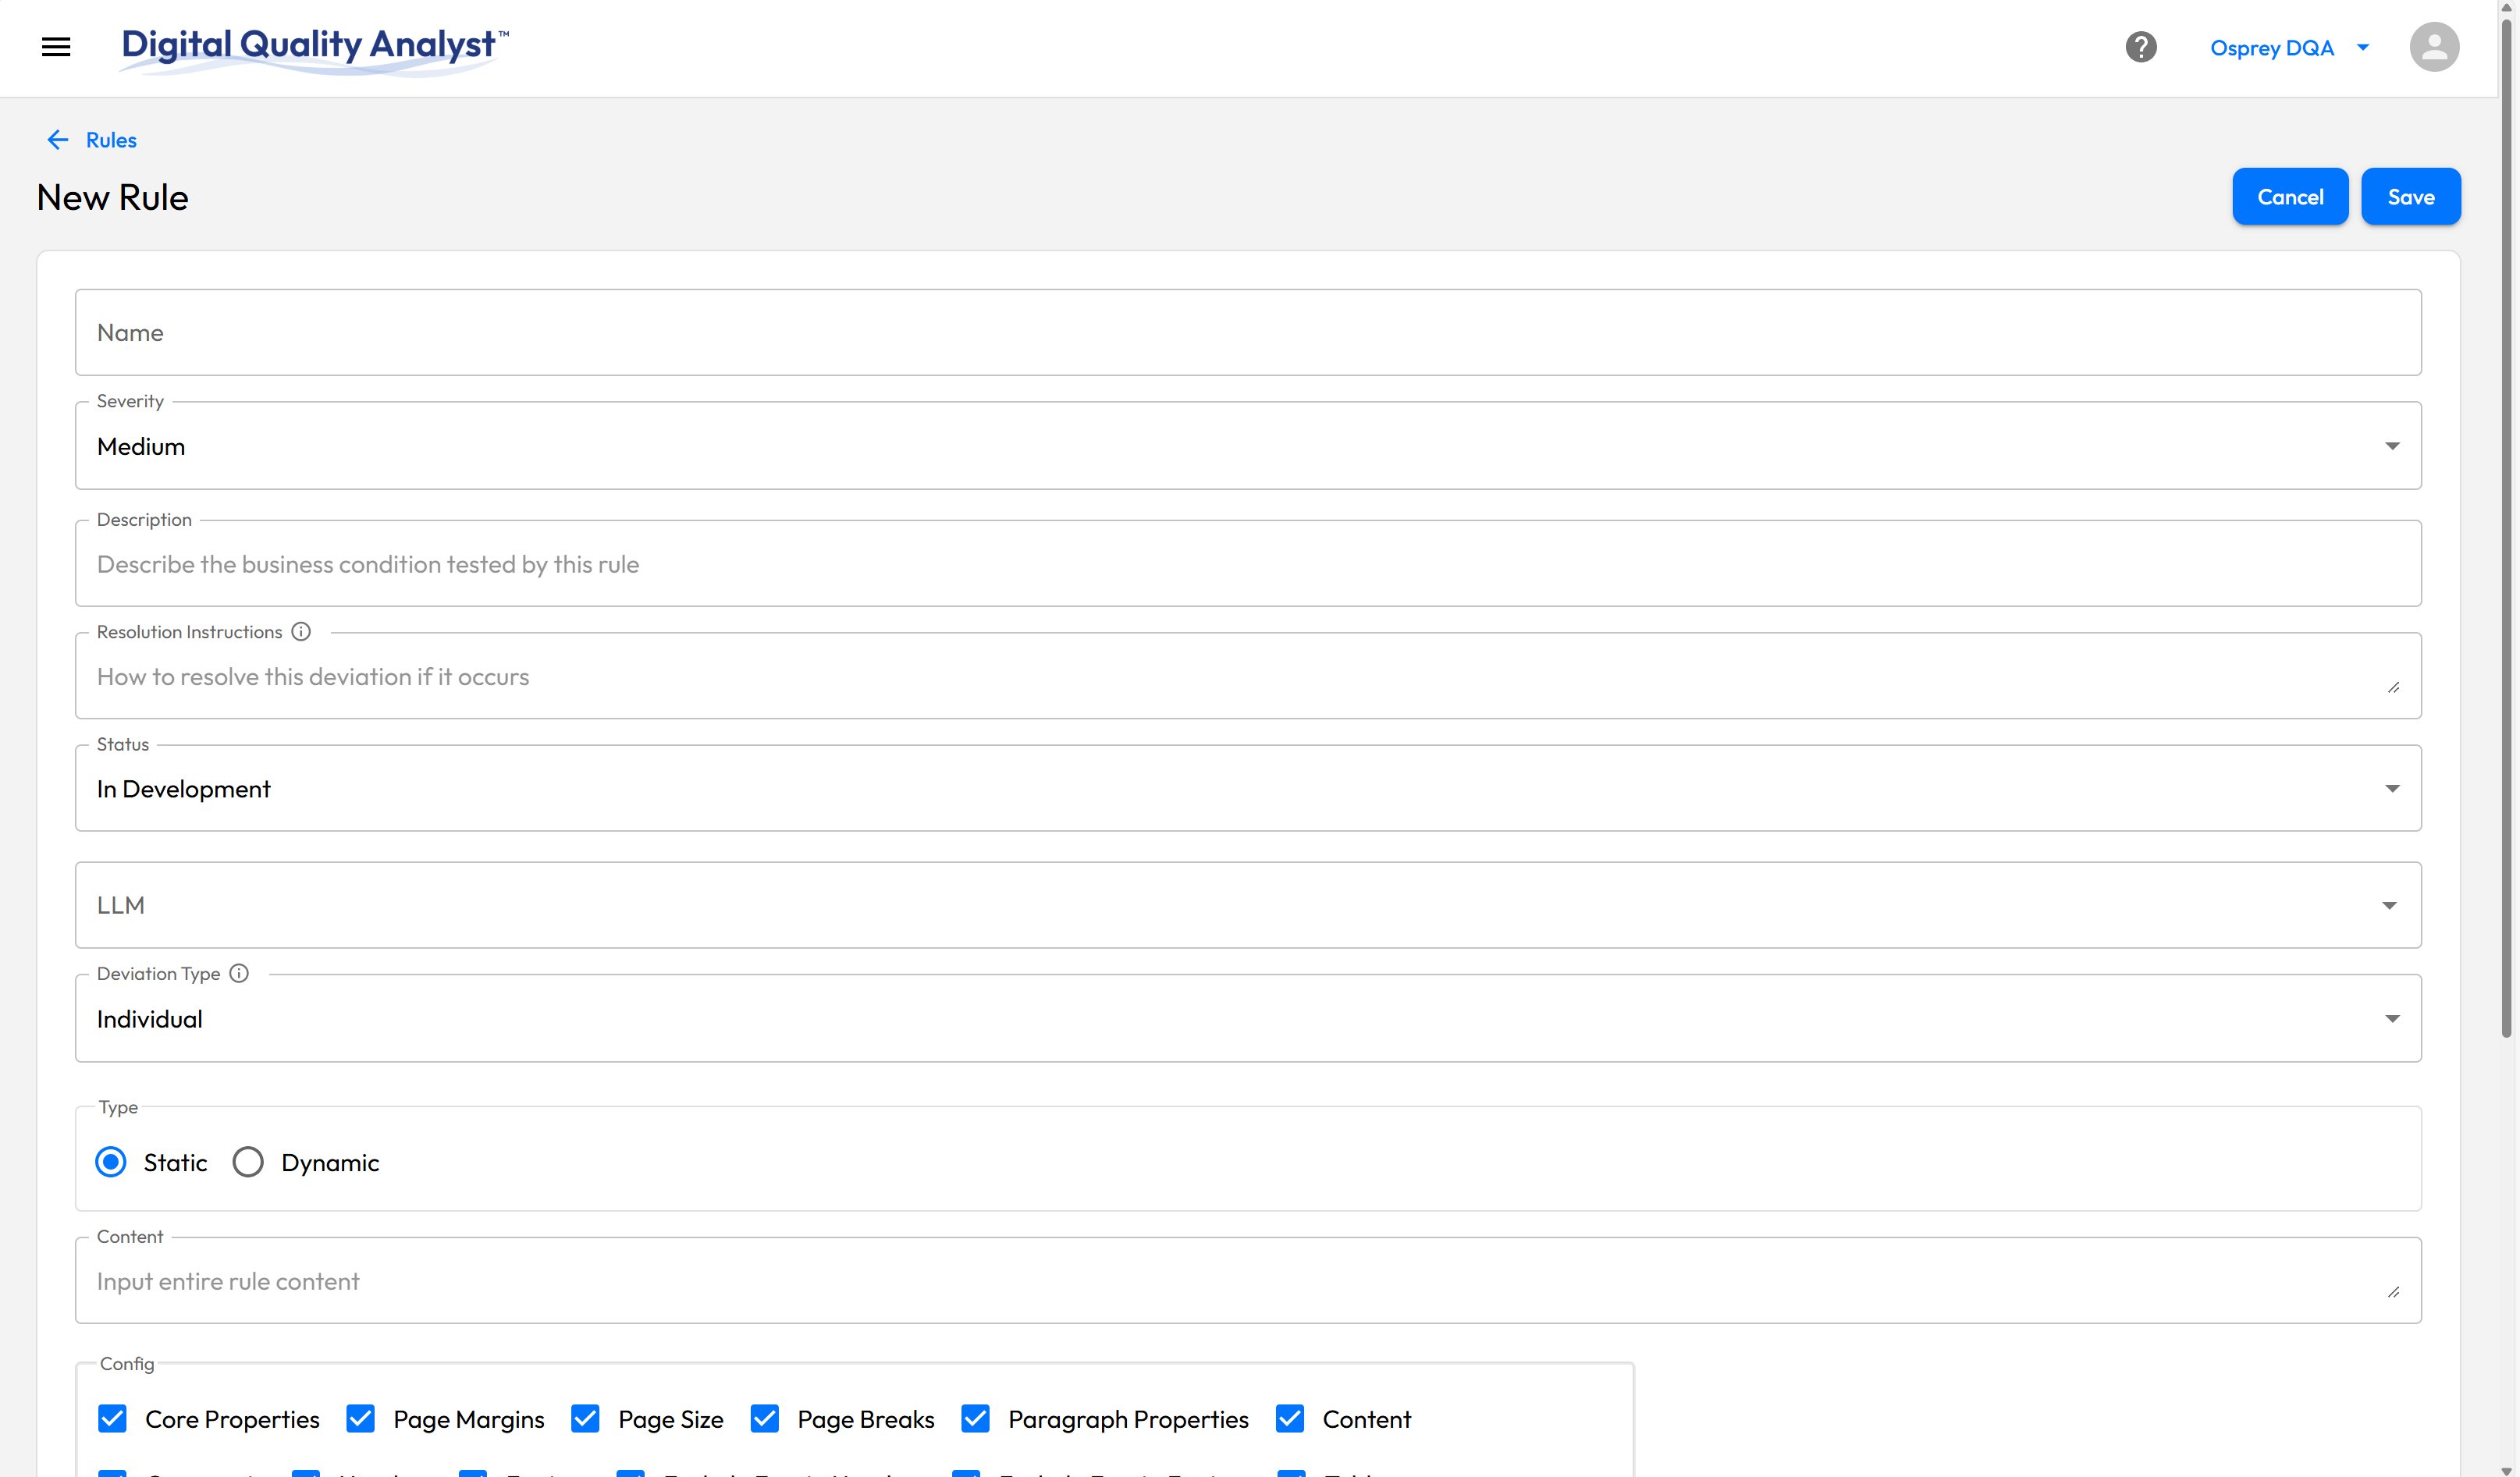
The original layout with limited structure and unclear groupings.
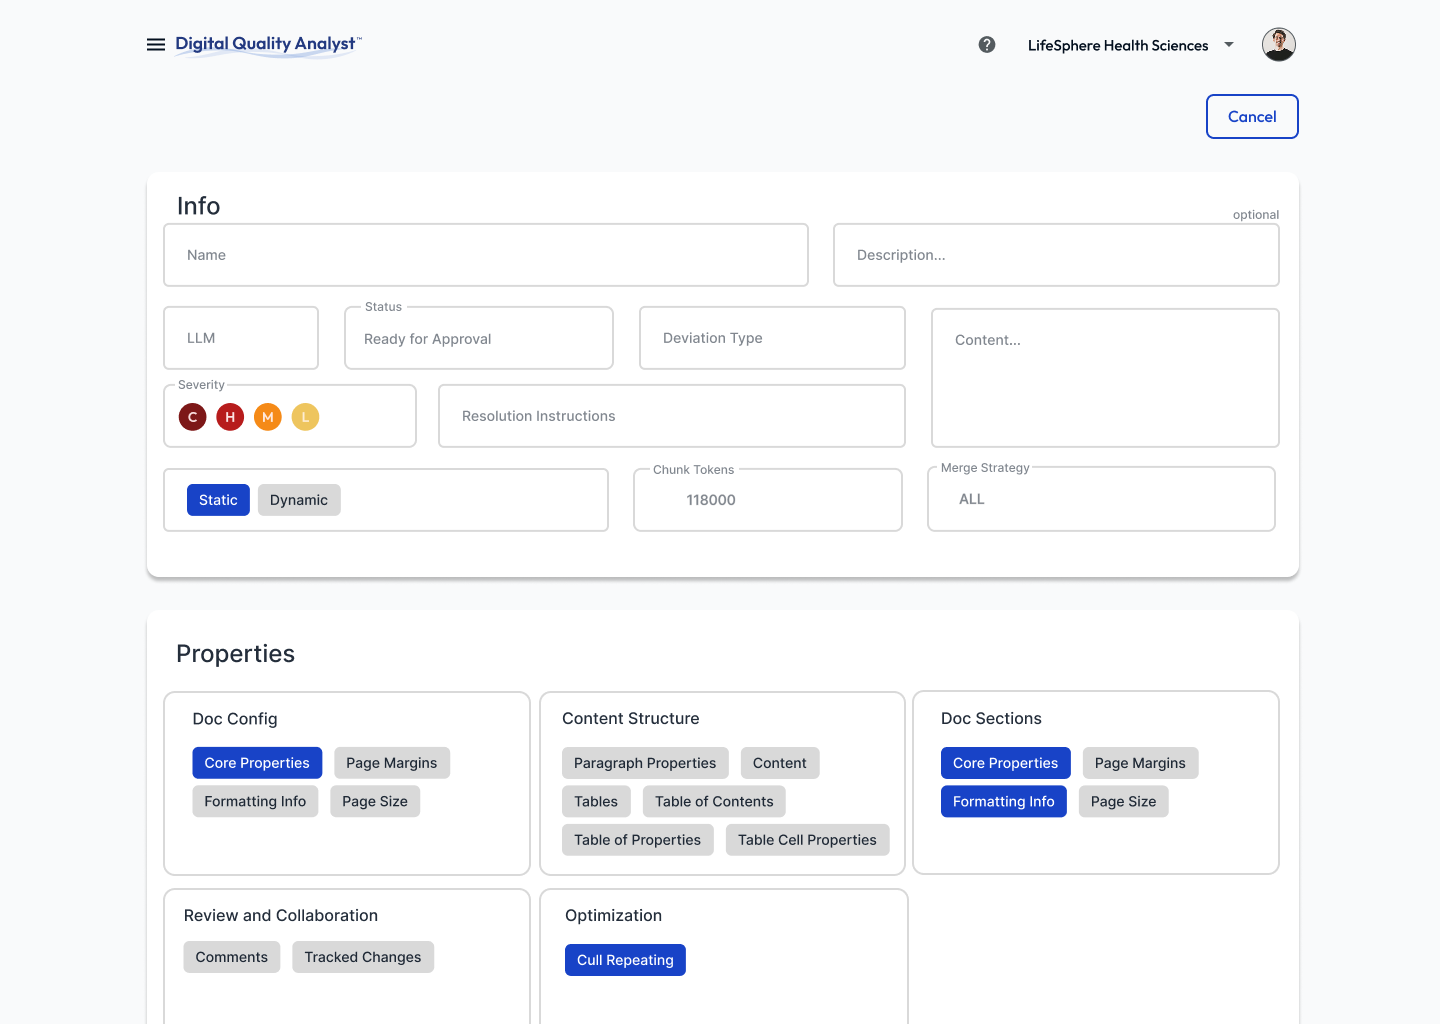
Intentional spacing, grouped properties, and refined selection styling improve hierarchy and workflow clarity.
The Dashboard is a customer-facing tool where users review and manage analyzed documents. I was tasked with creating concepts that added analytics cards at the top for quick insights and rethought how documents are displayed to improve scanability.
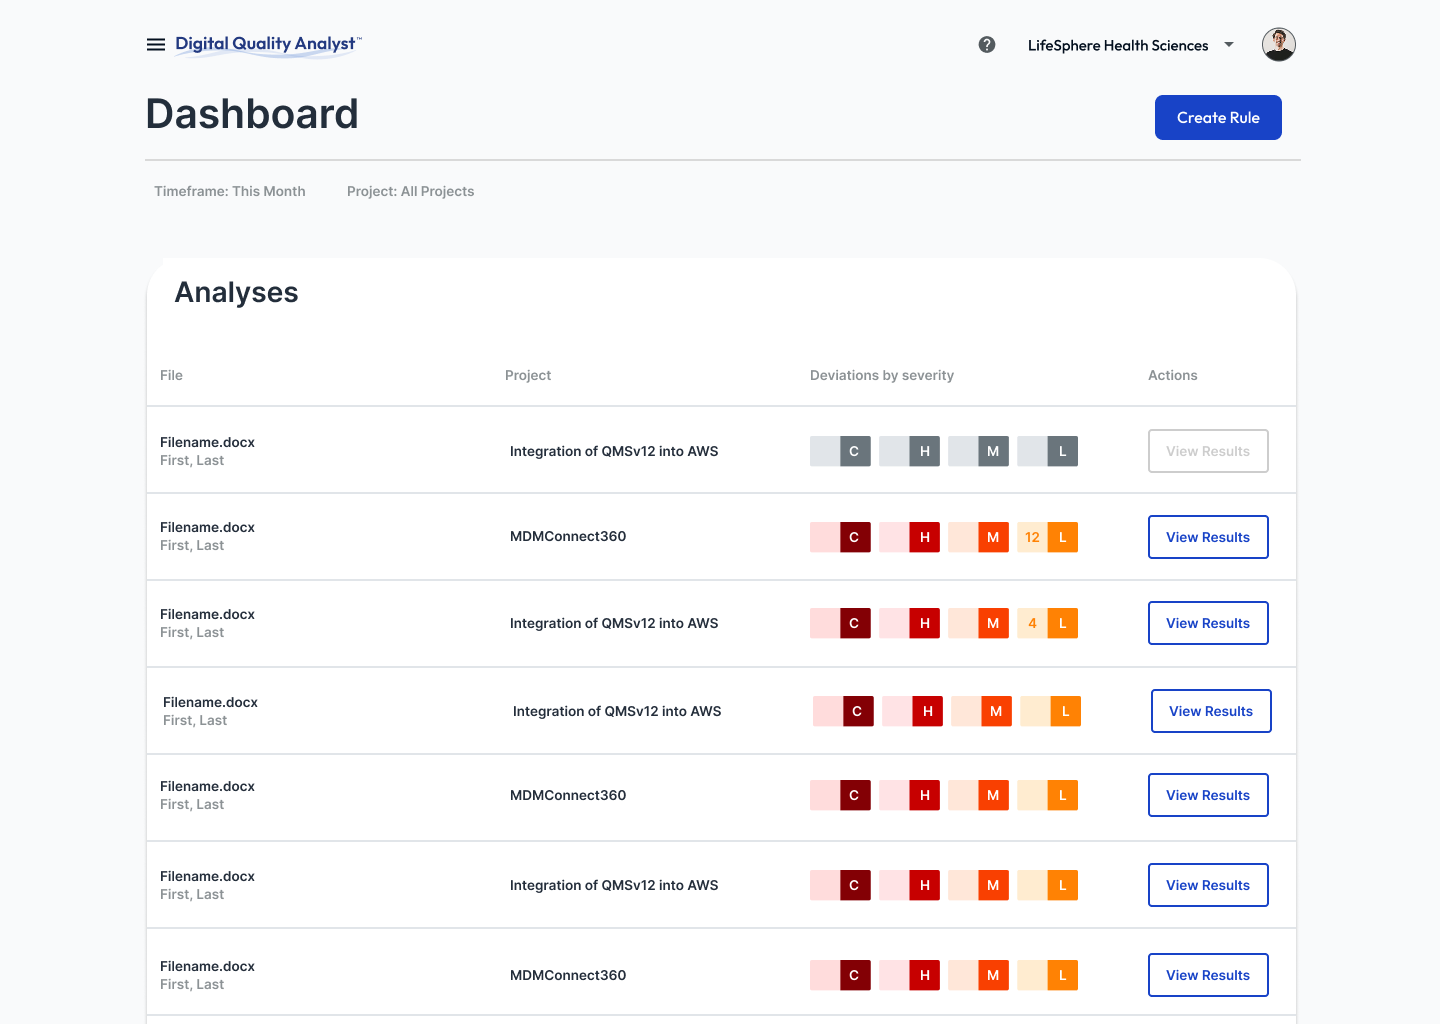
Original layout recreated for comparison purposes.
I created two redesign concepts, each taking a different approach to document display.
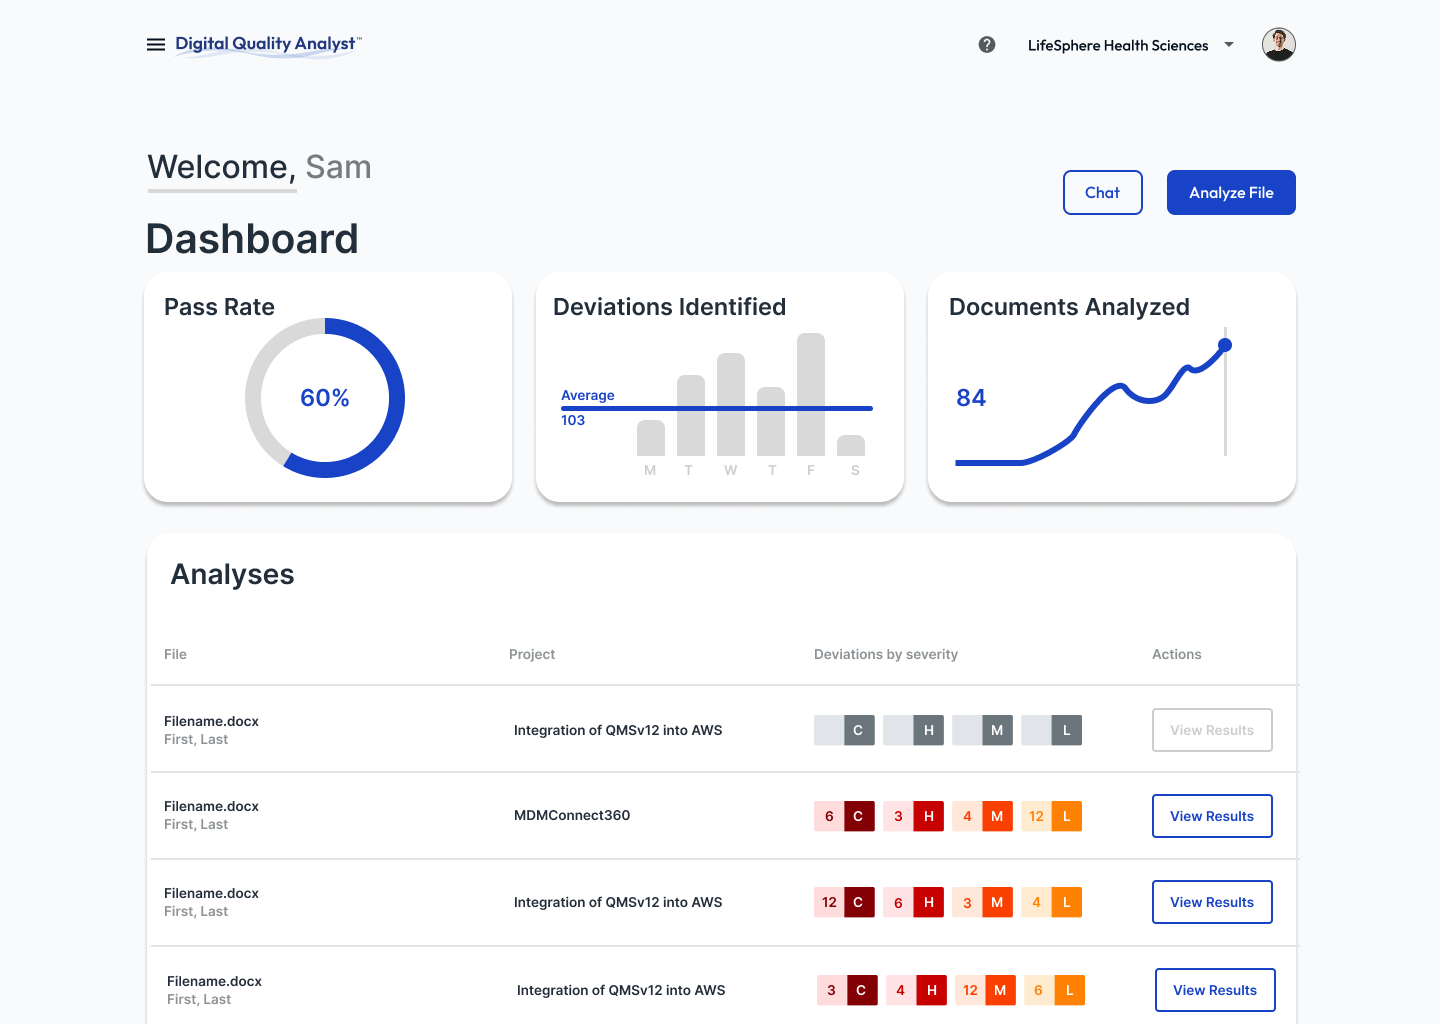
Retains the familiar list layout but with reorganized spacing and hierarchy for improved scanability.
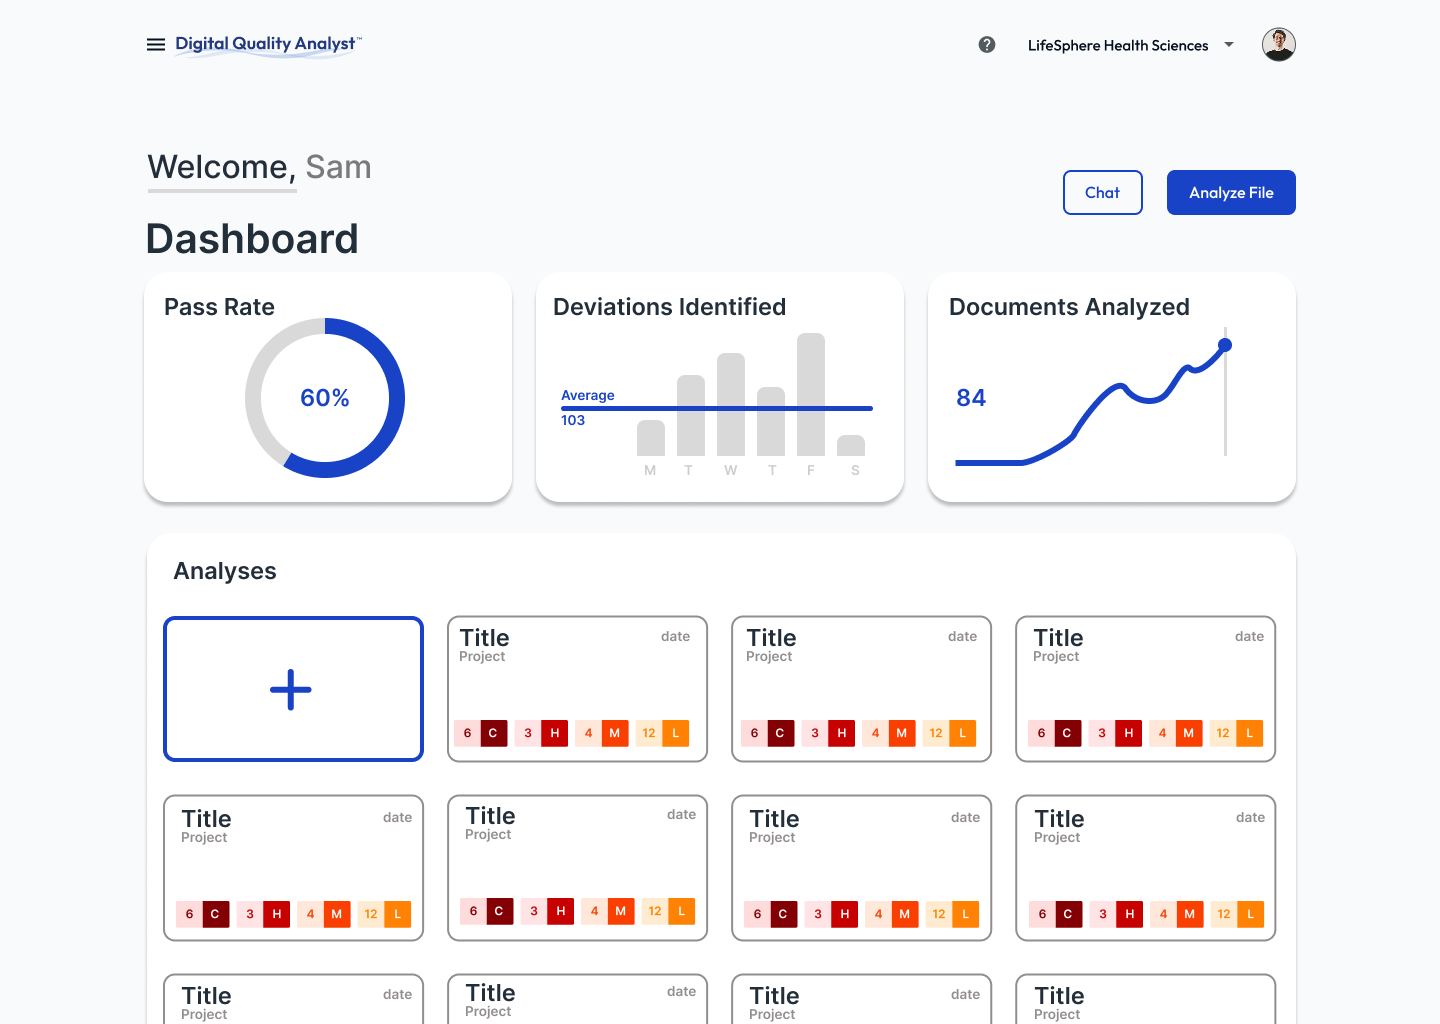
Documents as individual cards, more visual and modular, emphasizing key metadata and document status at a glance.
04 · Reflection
This project strengthened my ability to work in a cross-functional team of developers. It required clarity, consistency, and thoughtful documentation to ensure design decisions translated effectively into implementation. Designing for a data-heavy environment was particularly challenging, balancing the need to include extensive information while maintaining clarity and consideration of cognitive load. It reinforced the importance of designing not for aesthetics but for efficiency, clarity and implementation.